
A framework for making sense of metrics in technical organizations
Published:
If you work in a quantitative or technical field, there is little doubt that you or your team has worked long and hard to define which metrics to measure and track. Using data-driven metrics is a critical practice for making rational decisions and deciphering truth in a complex and noisy world. However, as others have pointed out, an over-reliance on metrics can lead to poor outcomes. In an effort to better articulate the value and risks inherent in metrics, in this blog post, I will present a mental framework for thinking about metrics that has helped me reason about their value and risks with a bit more clarity.
Introduction
For good reason, the importance of data-driven reasoning is deeply ingrained in the culture of quantitative and technical disciplines. Moreover, the systems we both build and operate within are too complex to be fully grasped by the human mind. To understand them, we must measure them. The combined consequences of our secular cultural traditions, and the simple need to understand complex systems, lead technical organizations to fixate on metrics. This reliance on metrics is deeply ingrained. Managers repeat quotes like, “You can’t manage what you can’t measure.” Software engineers create dashboards and databases to track metrics. Meetings often begin with an overview of where the project or business stands in terms of the metrics.
I would by no means be the first to point out that an over-reliance on metrics can lead to poor outcomes. For example, Goodhart’s Law states, “When a measure becomes a target, it ceases to be a good measure.” In a recent interview, Jeff Bezos describes how organizations often end up mistaking metrics meant to measure some ground truth as the actual thing. This mistaking a “proxy for truth” for the actual truth leads organizations astray.
Metrics are therefore tricky: On the one hand, metrics are critical for navigating a complex world. On the other hand, they can lead organizations astray. Because of this, in my personal experience, I have found organizations struggle to really wield metrics well and think about them clearly. In an effort to better articulate the value and risks inherent in metrics, in this blog post, I will present a mental framework for thinking about metrics that has helped me reason about them with a bit more clarity.
This framework entails first treating systems as high-dimensional objects in some abstract space. A metric then, is a function that maps those systems to numbers. With this framing, we can categorize metrics into two groups: exploratory metrics and those that are used to approximate value. Because metrics serve merely as an approximation, one must take care to understand clearly the behavior of that approximation. In some extreme cases, it might be better to admit that no metric can serve as a good approximator of value.
Systems as high-dimensional objects
Before we get to discussing metrics, we will first generalize the system being measured as a high-dimensional object in some abstract space (akin to a vector space). By “system”, I mean any complicated thing that a given technical organization seeks to understand or improve.
For example, such a system under consideration might be an entire business; Businesses are complicated “high-dimensional” objects in that they have many components: employees, processes, capital, debt, revenue, and so on. A piece of technology is also such a system. For example, an algorithm for automating medical diagnoses has many aspects: model complexity, latency, lines of code, bias, etc.
In a very abstract way, one can imagine that any given system resides in a “space” comprising other similar systems. For simplicity, let’s take a business: We can summarize a business in terms of a large list of numbers like number of employees, sales per month, cost of goods sold, cash on hand, debt… (the list can go on and on). Given such a list (which could be extremely long), we can place the business in a coordinate vector space where each location in the vector space is some (possibly non-existent) business. A schematic with three dimensions is shown below:
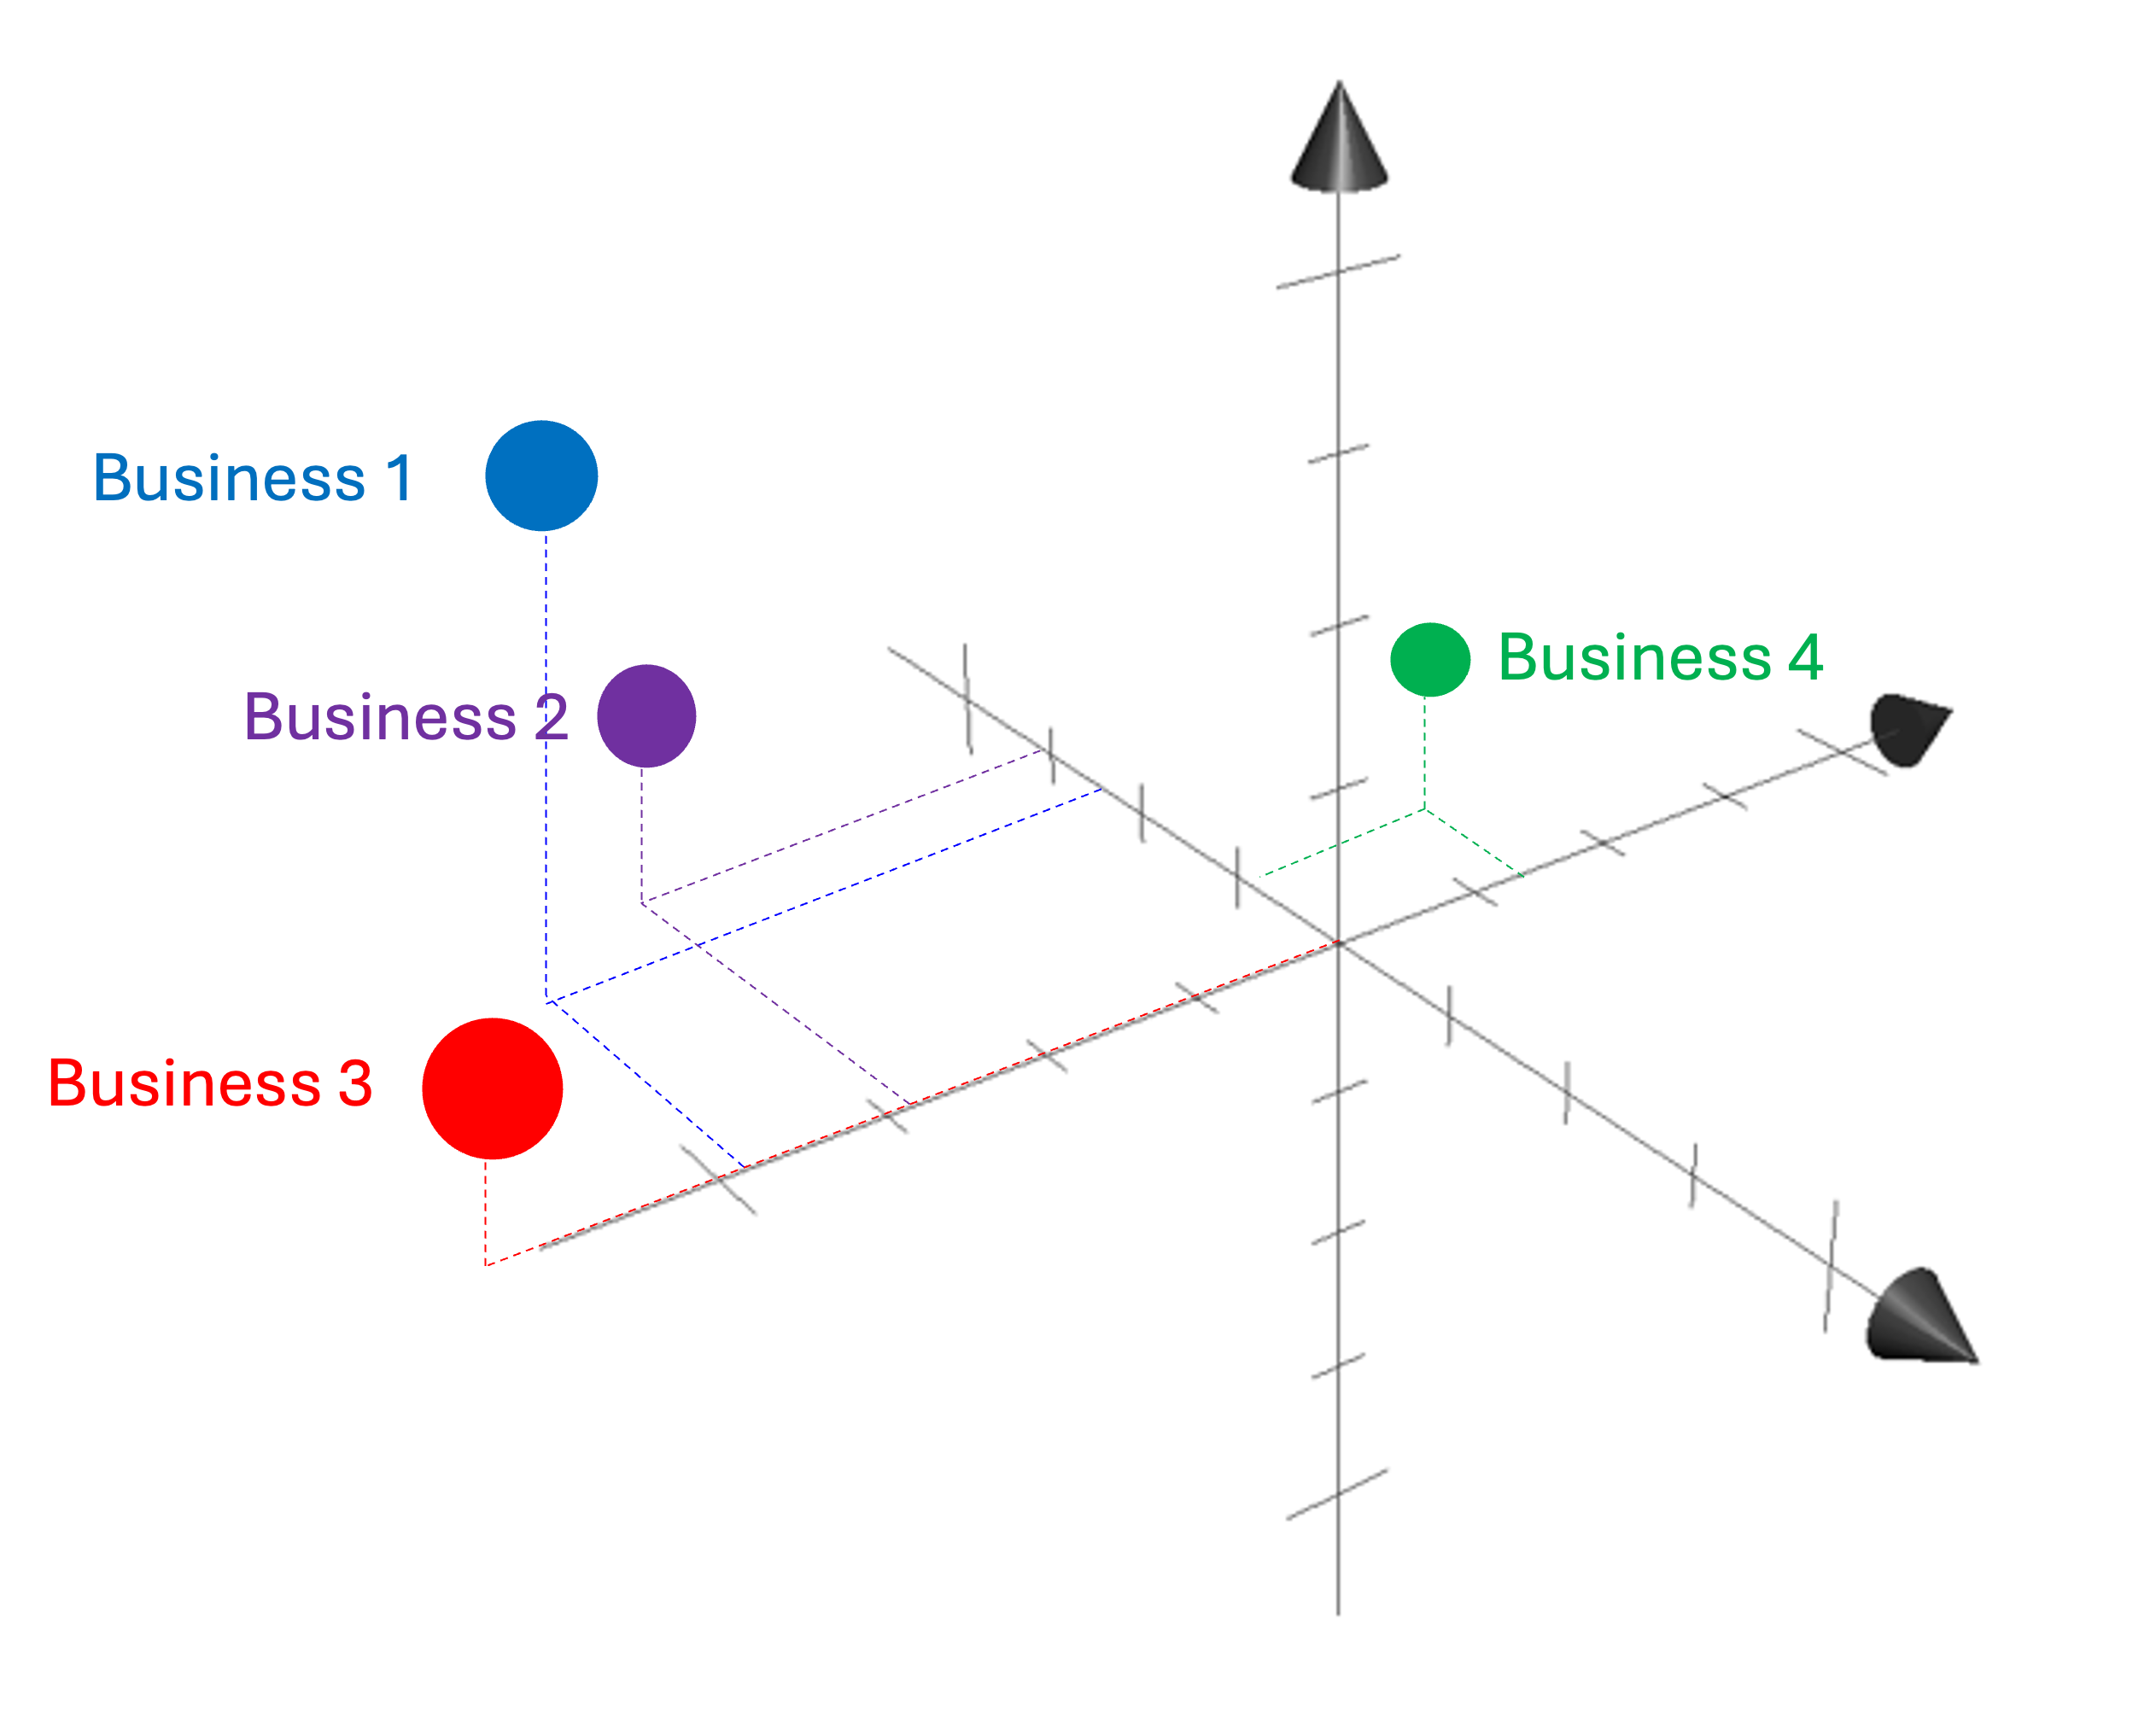
We will denote this space of possible systems (e.g., businesses) as $\mathcal{X}$. A given system $x$ is a member of $\mathcal{X}$, denoted $x \in \mathcal{X}$.
Value functions tell you how “good” a system is
We consider cases in which the goal of an organization to either improve some system under measurement, $x \in \mathcal{X}$, or,at the very least, to assess how “good” the system is in terms of some subjective or economic measure of value.
Let’s define a value function to be a function $V$ that maps systems in $\mathcal{X}$ to real numbers that quantify the value of those systems:
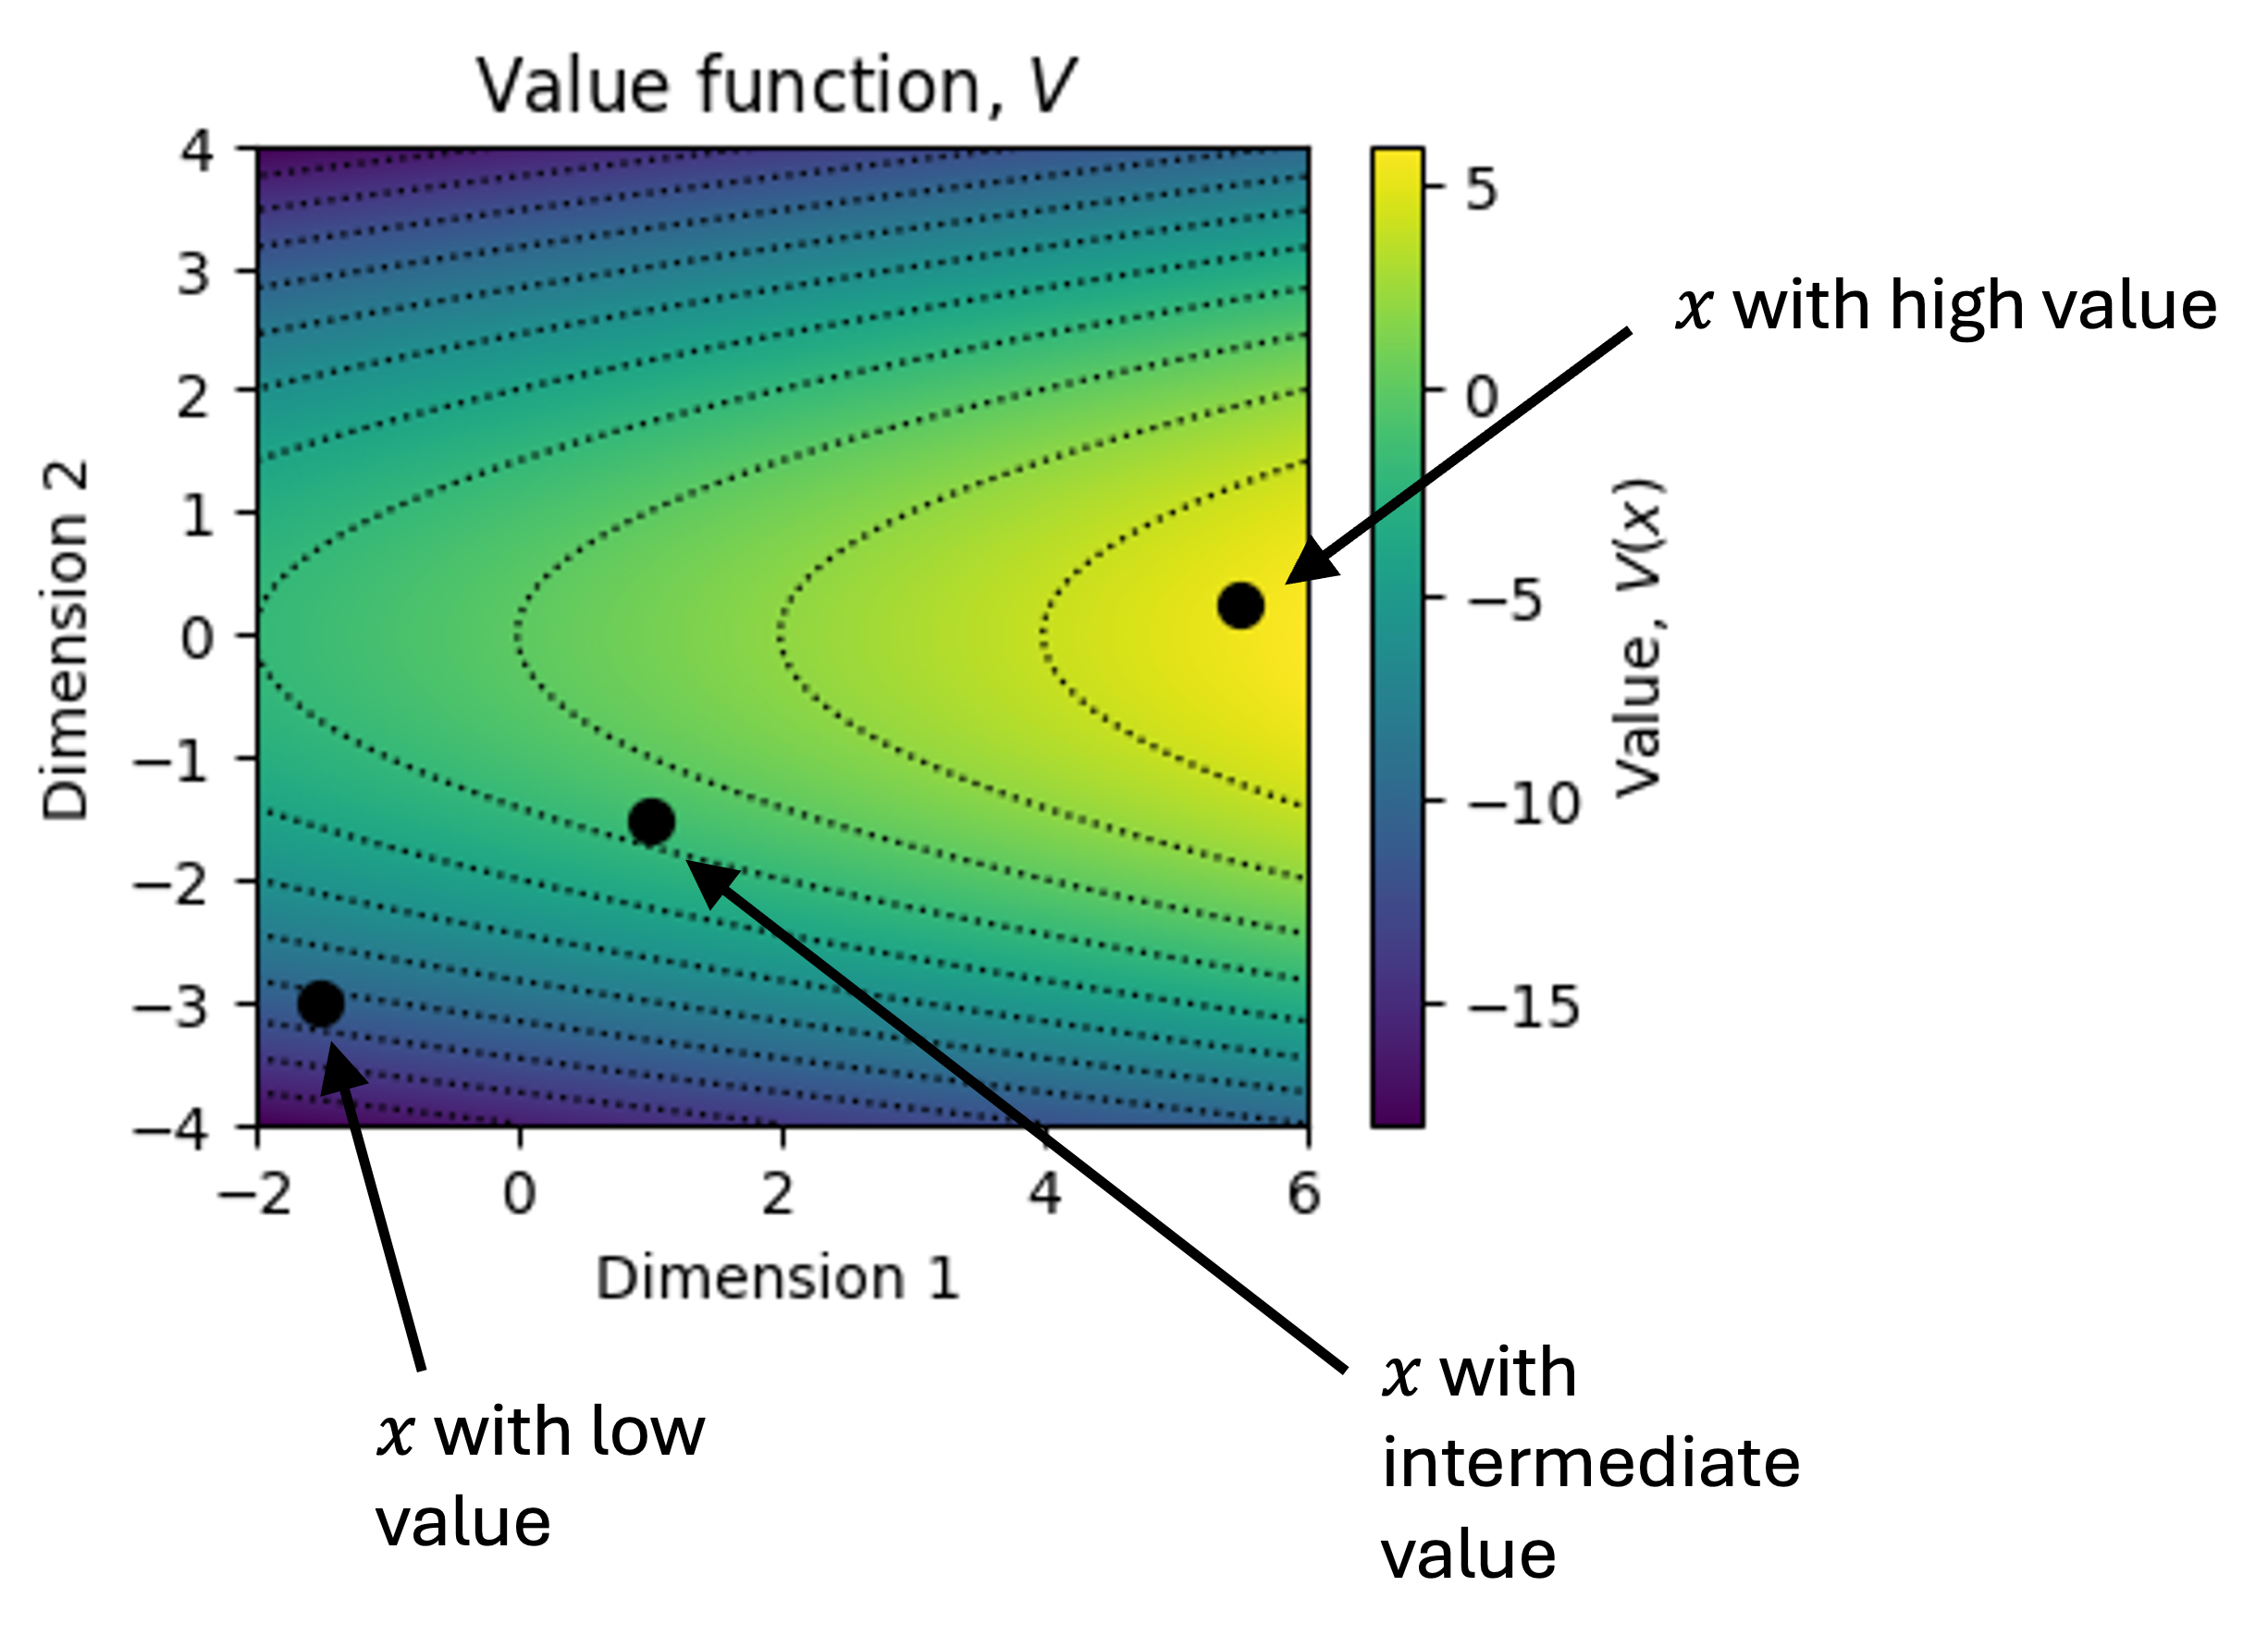
\[V : \mathcal{X} \rightarrow \mathbb{R}\]That is, $V(x)$ tells us how much to value system $x$. If we have two systems, $x_1$ and $x_2$, then $V(x_1) > V(x_2)$ tells us we should prefer $x_1$ to $x_2$. We can depict this schematically in a small, two-dimensional space of systems with a heatmap. Each dot in the figure below is a system. The color tells us how much value that system has:
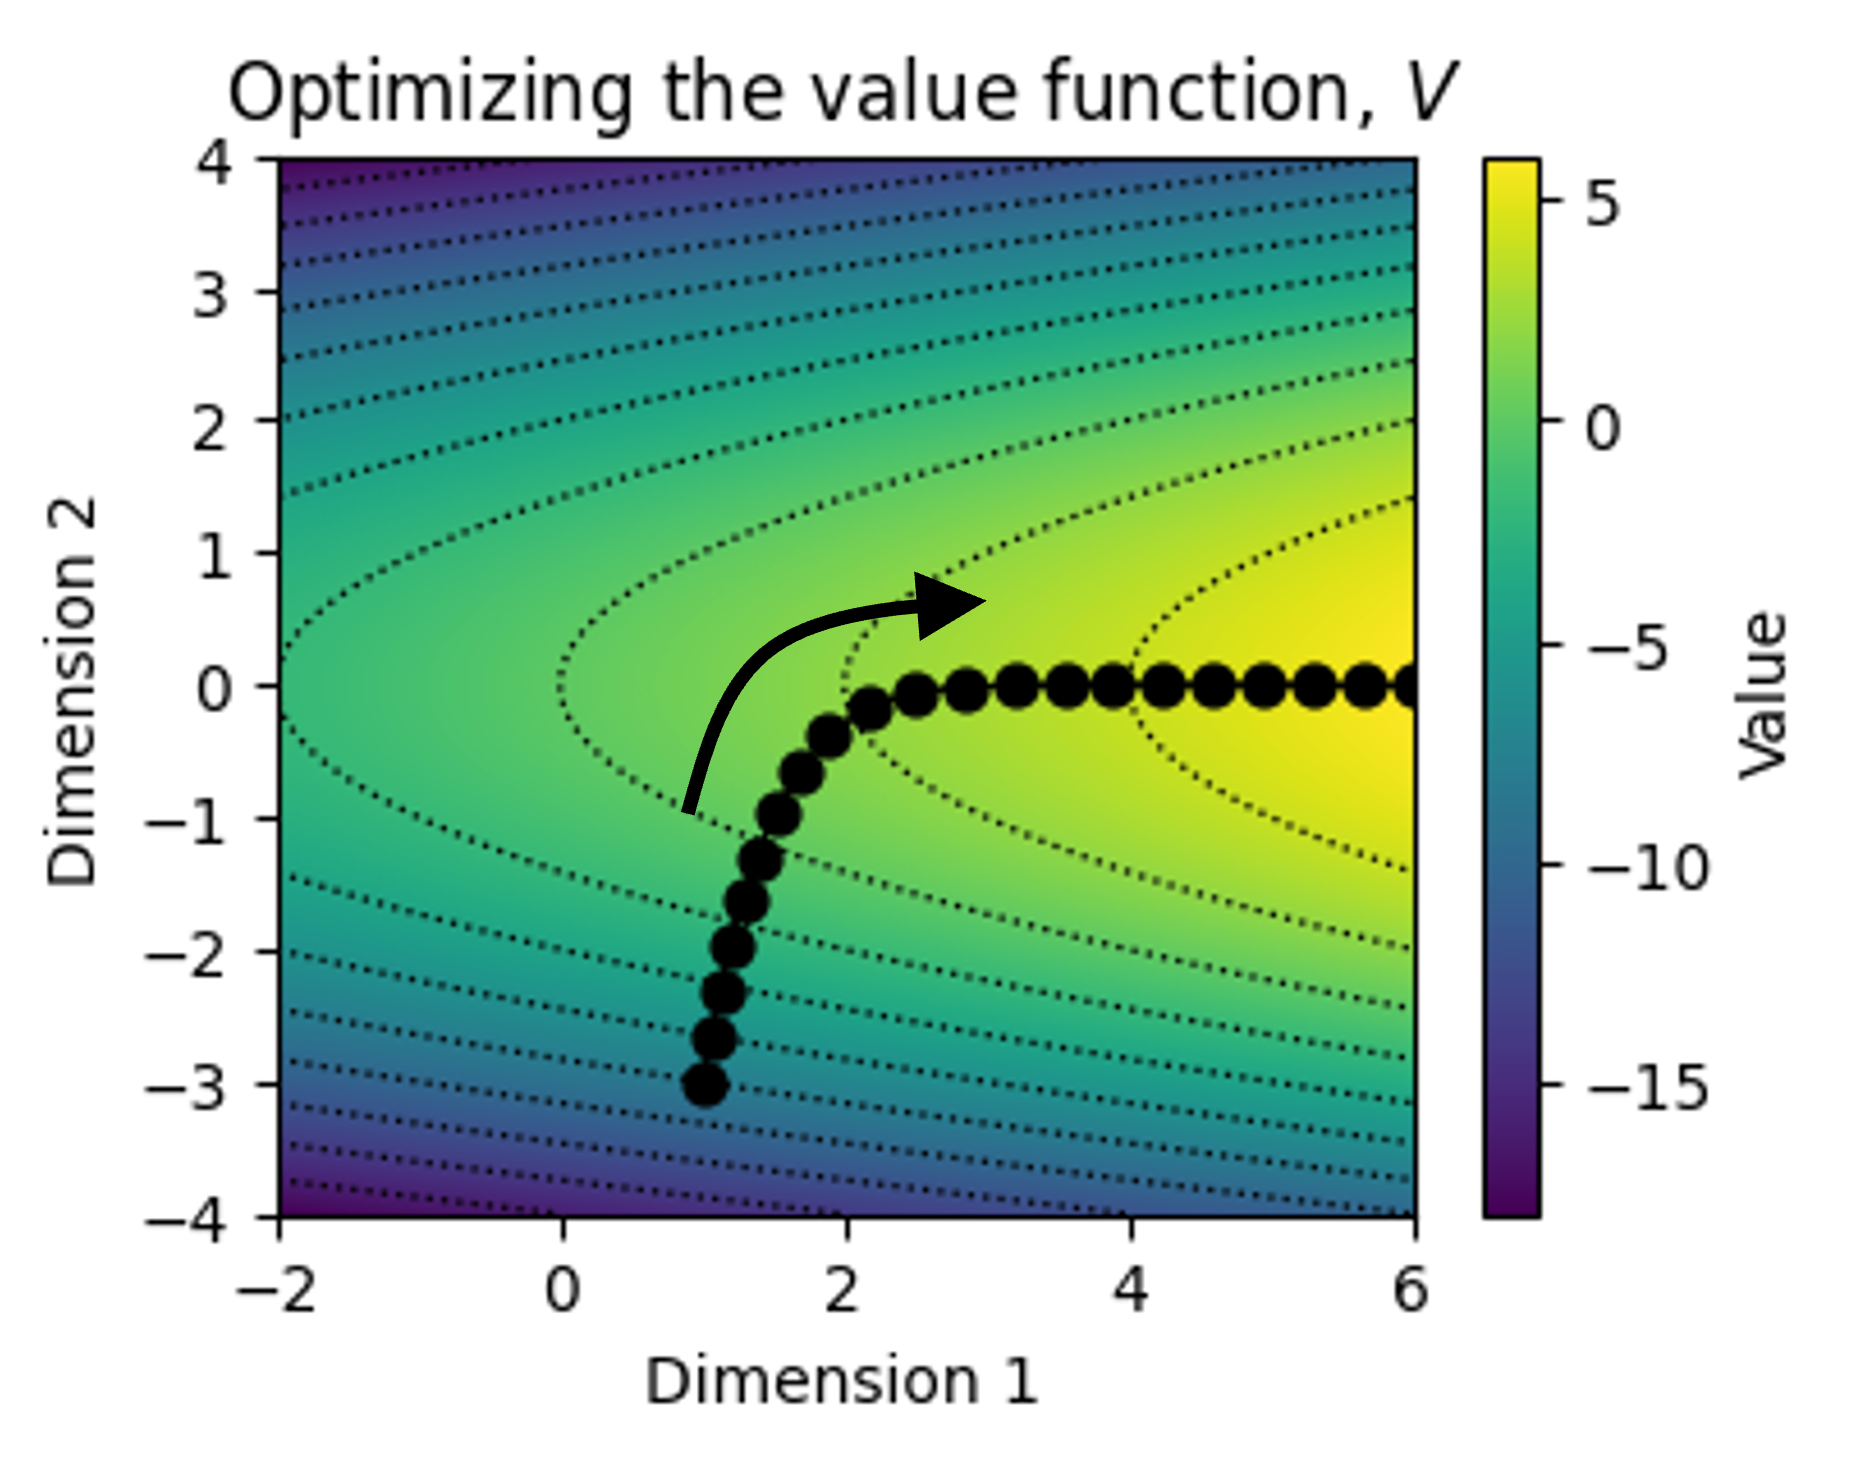
Organizations that seek to maximize $V$ are in a sense performing a form of “gradient descent” over $V$:
\[x' \leftarrow x + \nabla V(x)\]where the goal is to make iterative progress along $V$. Below is a toy example of a system undergoing iteration as it progresses along the surface of the value function:
In some situations, the value function is obvious. For example, when considering a business, the value function might simply be its profitability. However, in other cases, the value function is not so easy to define. A premier example in this situation is judging the aesthetic value of artistic works.
I would also argue that even in technical fields, where the system under study should admit an easy-to-define value function, it is often not as clear-cut as one would hope. Take for example an algorithm for detecting tumors in medical imaging data. As some in this field would note, metrics like accuracy are not the true value function. In truth, the value function should track something like, “expected benefit versus harm” when employing the algorithm in a real clinical context, but that is not trivial to define!
Metrics are functions that can be either exploratory or value-approximating
Using this same framework, we can define a metric to be some function that, like $V$, projects a system, $x \in \mathcal{X}$, to a number. That is, we can define a metric, $f$, to be a function,
\[f: \mathcal{X} \rightarrow \mathbb{R}\]Metrics fall into two fundamentally different categories: those that are intended to approximate the value function $V$, and those that are intended purely to explore and describe the structure of $\mathcal{X}$. These two uses impose very different requirements. A value-approximating metric makes an implicit claim about the relationship between $f$ and $V$. To rely on such a metric, one must understand where this approximation holds. Exploratory metrics, by contrast, make no claim about value at all. I believe that making a clear distinction between these kinds of metrics can bring clarity to discussions around them. We describe these two categories in the following sections.
Exploratory metrics: Those that seek to describe $\mathcal{X}$
In many cases, organizations do not seek to necessarily approximate the value function, but instead simply seek to understand their system. To gain this understanding, they will create a collection of metrics, $f_1, f_2, …, f_M$, each describing some specific aspect of the system. In this way, these metrics project the complex, high-dimensional system into the space of a few dimensions (In this sense, the metrics act as a form of dimensionality reduction).
The goal here is to gain a mechanistic understanding of the system. That is, the goal is to gain a holistic understanding of the system, which may lead to new insights into how to improve the system downstream of these metrics. The goal is not to track whether the system is improving over time.
Exploratory metrics are almost always critical for understanding a system, though I would note that numbers alone may not be sufficient. Sometimes, one must also understand the geometric relationships between these metrics, which are better grasped via visualization. Said differently, tracking the metrics may not alone be sufficient to gain adequete understanding. Rather, understanding may only come from synthesizing these metrics into a comprehensible visual format.
One final point on this topic: I believe it is important to clearly delineate whether a metric under consideration is an exploratory metric or a value approximating metric. As soon as one modifies the system under consideration to optimize some exploratory metric, $f(x)$, that implicitly moves the metric from the exploratory category to the value-approximating category.
Value-approximating metrics: Those that seek to approximate $V$
A value-approximating metric is a metric, $f(x)$, that is treated as a proxy for the value function, $V(x)$. Unlike exploratory metrics, which are merely observed, value approximating metrics are acted upon. More specifically, an organization changes the system, x, in the direction of the gradient of $f$. That is, the gradient of $f$ is used as a proxy for the gradient of $V$:
\[\nabla f(x) \approx \nabla V(x)\]Thus, it is important that one clearly knows whether or not $f$ is a good approximation for $V$. In the following sections, I will briefly describe two common ways in which $f$ may deviate from $V$.
Locally accurate, but globally innacurate
In this scenario, the metric $f$ is very close to $V$ in some local neighborhood around $x$; however, as the organization optimizes for $f$, it pushes the system into regions where $f$ is no longer a good approximation. This is a form of Goodhart’s Law; once one pushes $x$ too far along $f$, then $f$ ceases to be a good measure for $V$.
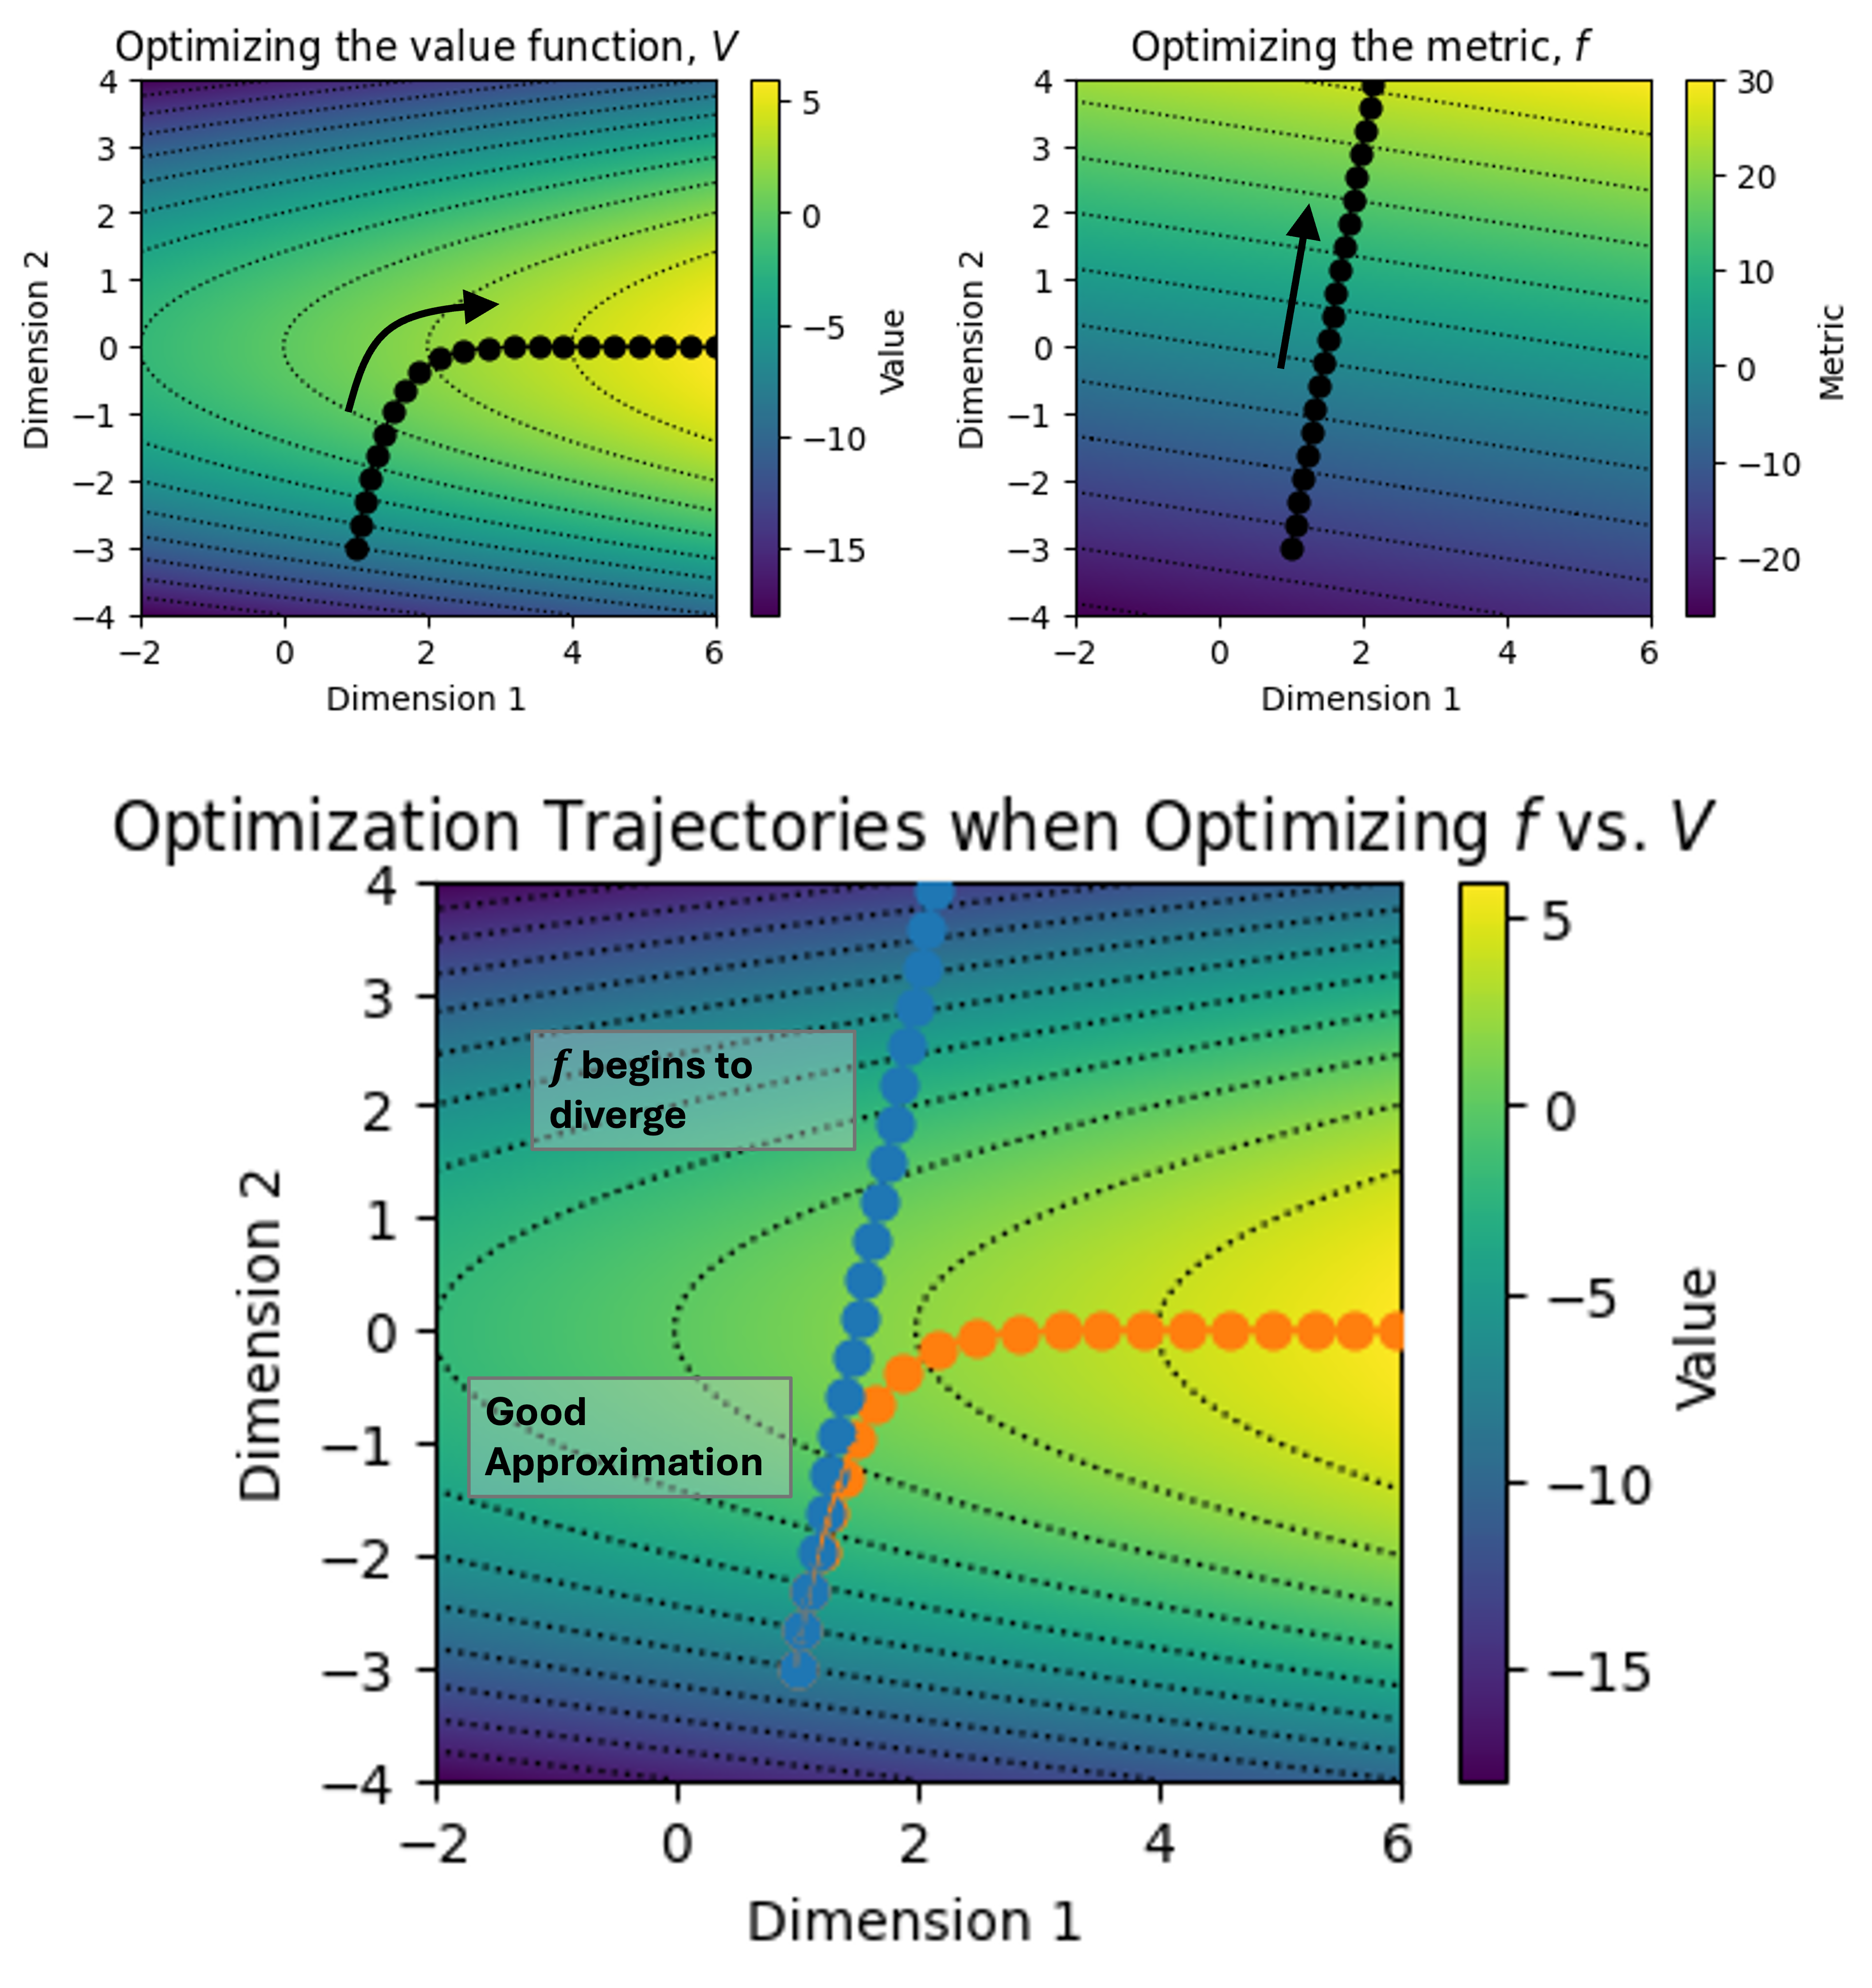
This is illustrated schematically in the figure below. In the top left figure, we show the true value function, $V$, and a trajectory we would take if we were optimizing with respect to it. In the top right figure, we show a metric function, $f$, and the trajectory we would take if we were optimizing $f$ instead. In the bottom figure, we superimpose the two trajectories (blue = $f$ and orange = $V$). As you can see, the two trajectories start off very close to one another, but then diverge as $x$ is optimized towards using $f$:
A premier example of this scenario occured recently in the Virtual Cell Challenge held by the Arc Institute. In this challenge, research groups competed to develop an AI model for predicting the effects that would result from either genetically or chemically perturbing biological cells. That is, the goal is to predict how a biological cell will react to a chemical or genetic alteration. In this challenge, groups found that they could game the metrics by applying absurd transformations to the data. These metrics, while perhaps a good proxy for the value function within the regime of $\mathcal{X}$ for which the Arc Institute designed the challenge, were a poor proxy of in distal regions of the space.
Monotonic with respect to $V$
In this situation, the metric $f$ increases “monotonically” with respect to $V$. By this I mean that if $f$ is increasing so too is $V$ and if $f$ is decreasing so too is $V$. An example is depicted below:
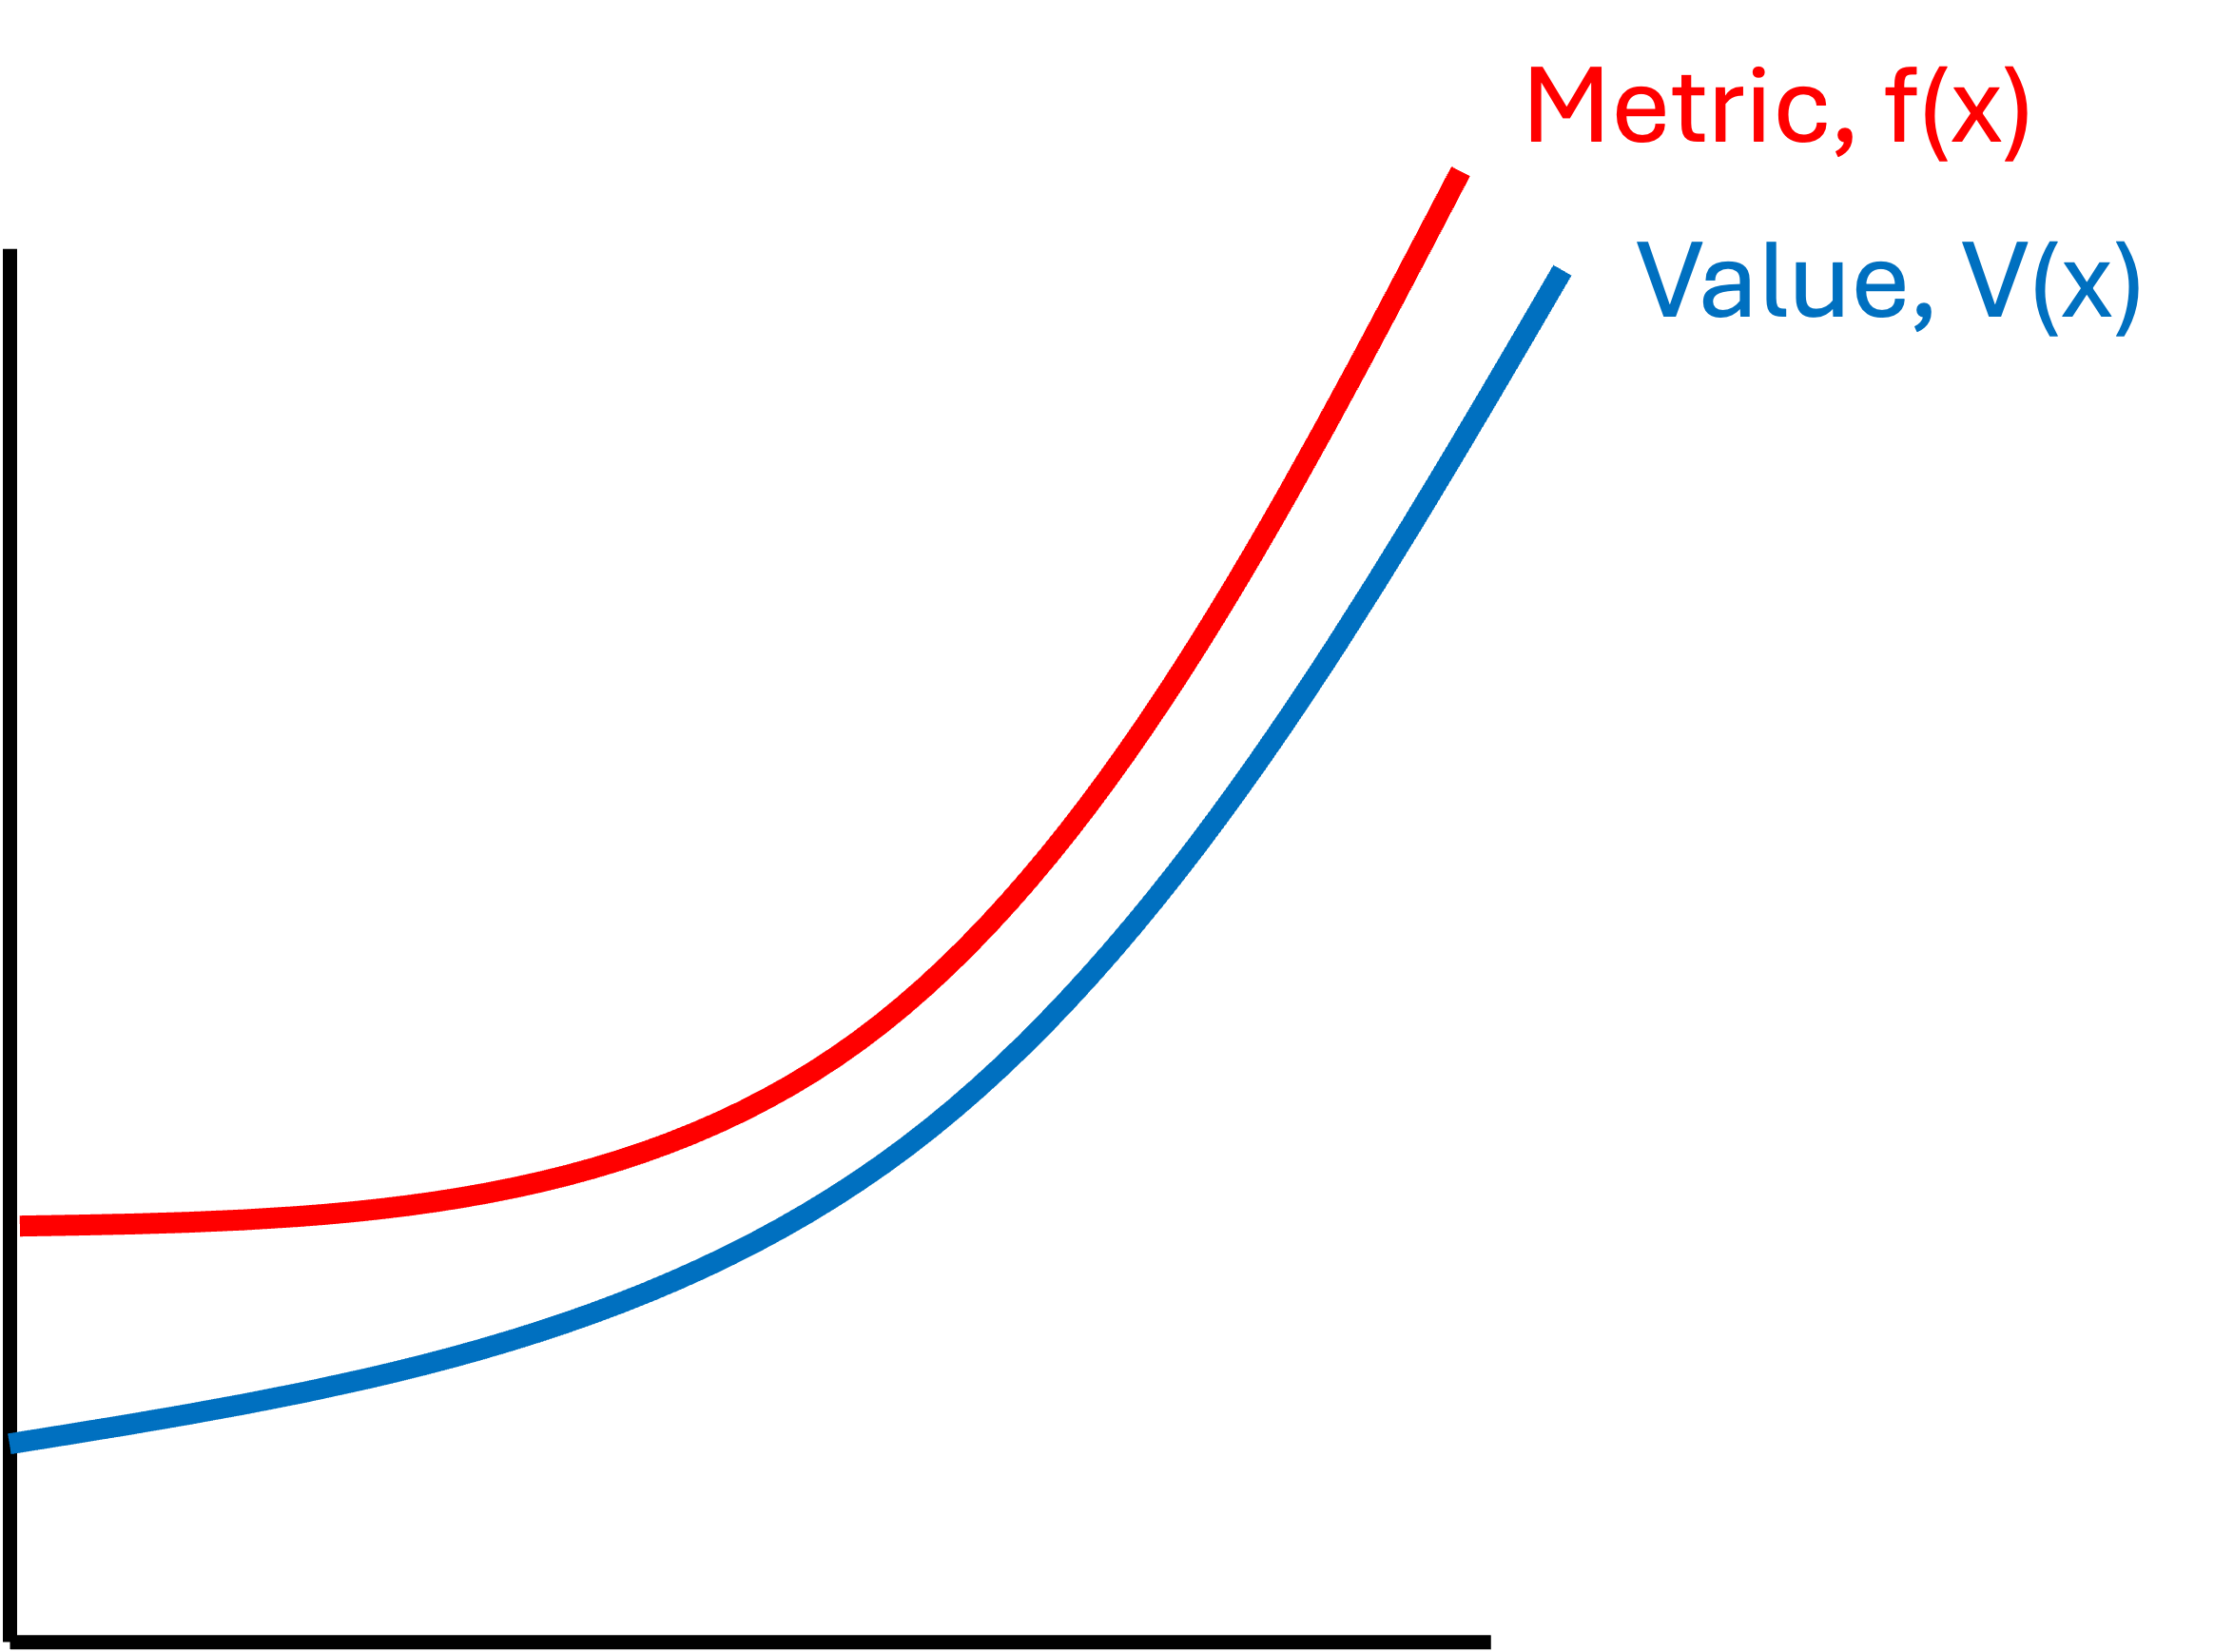
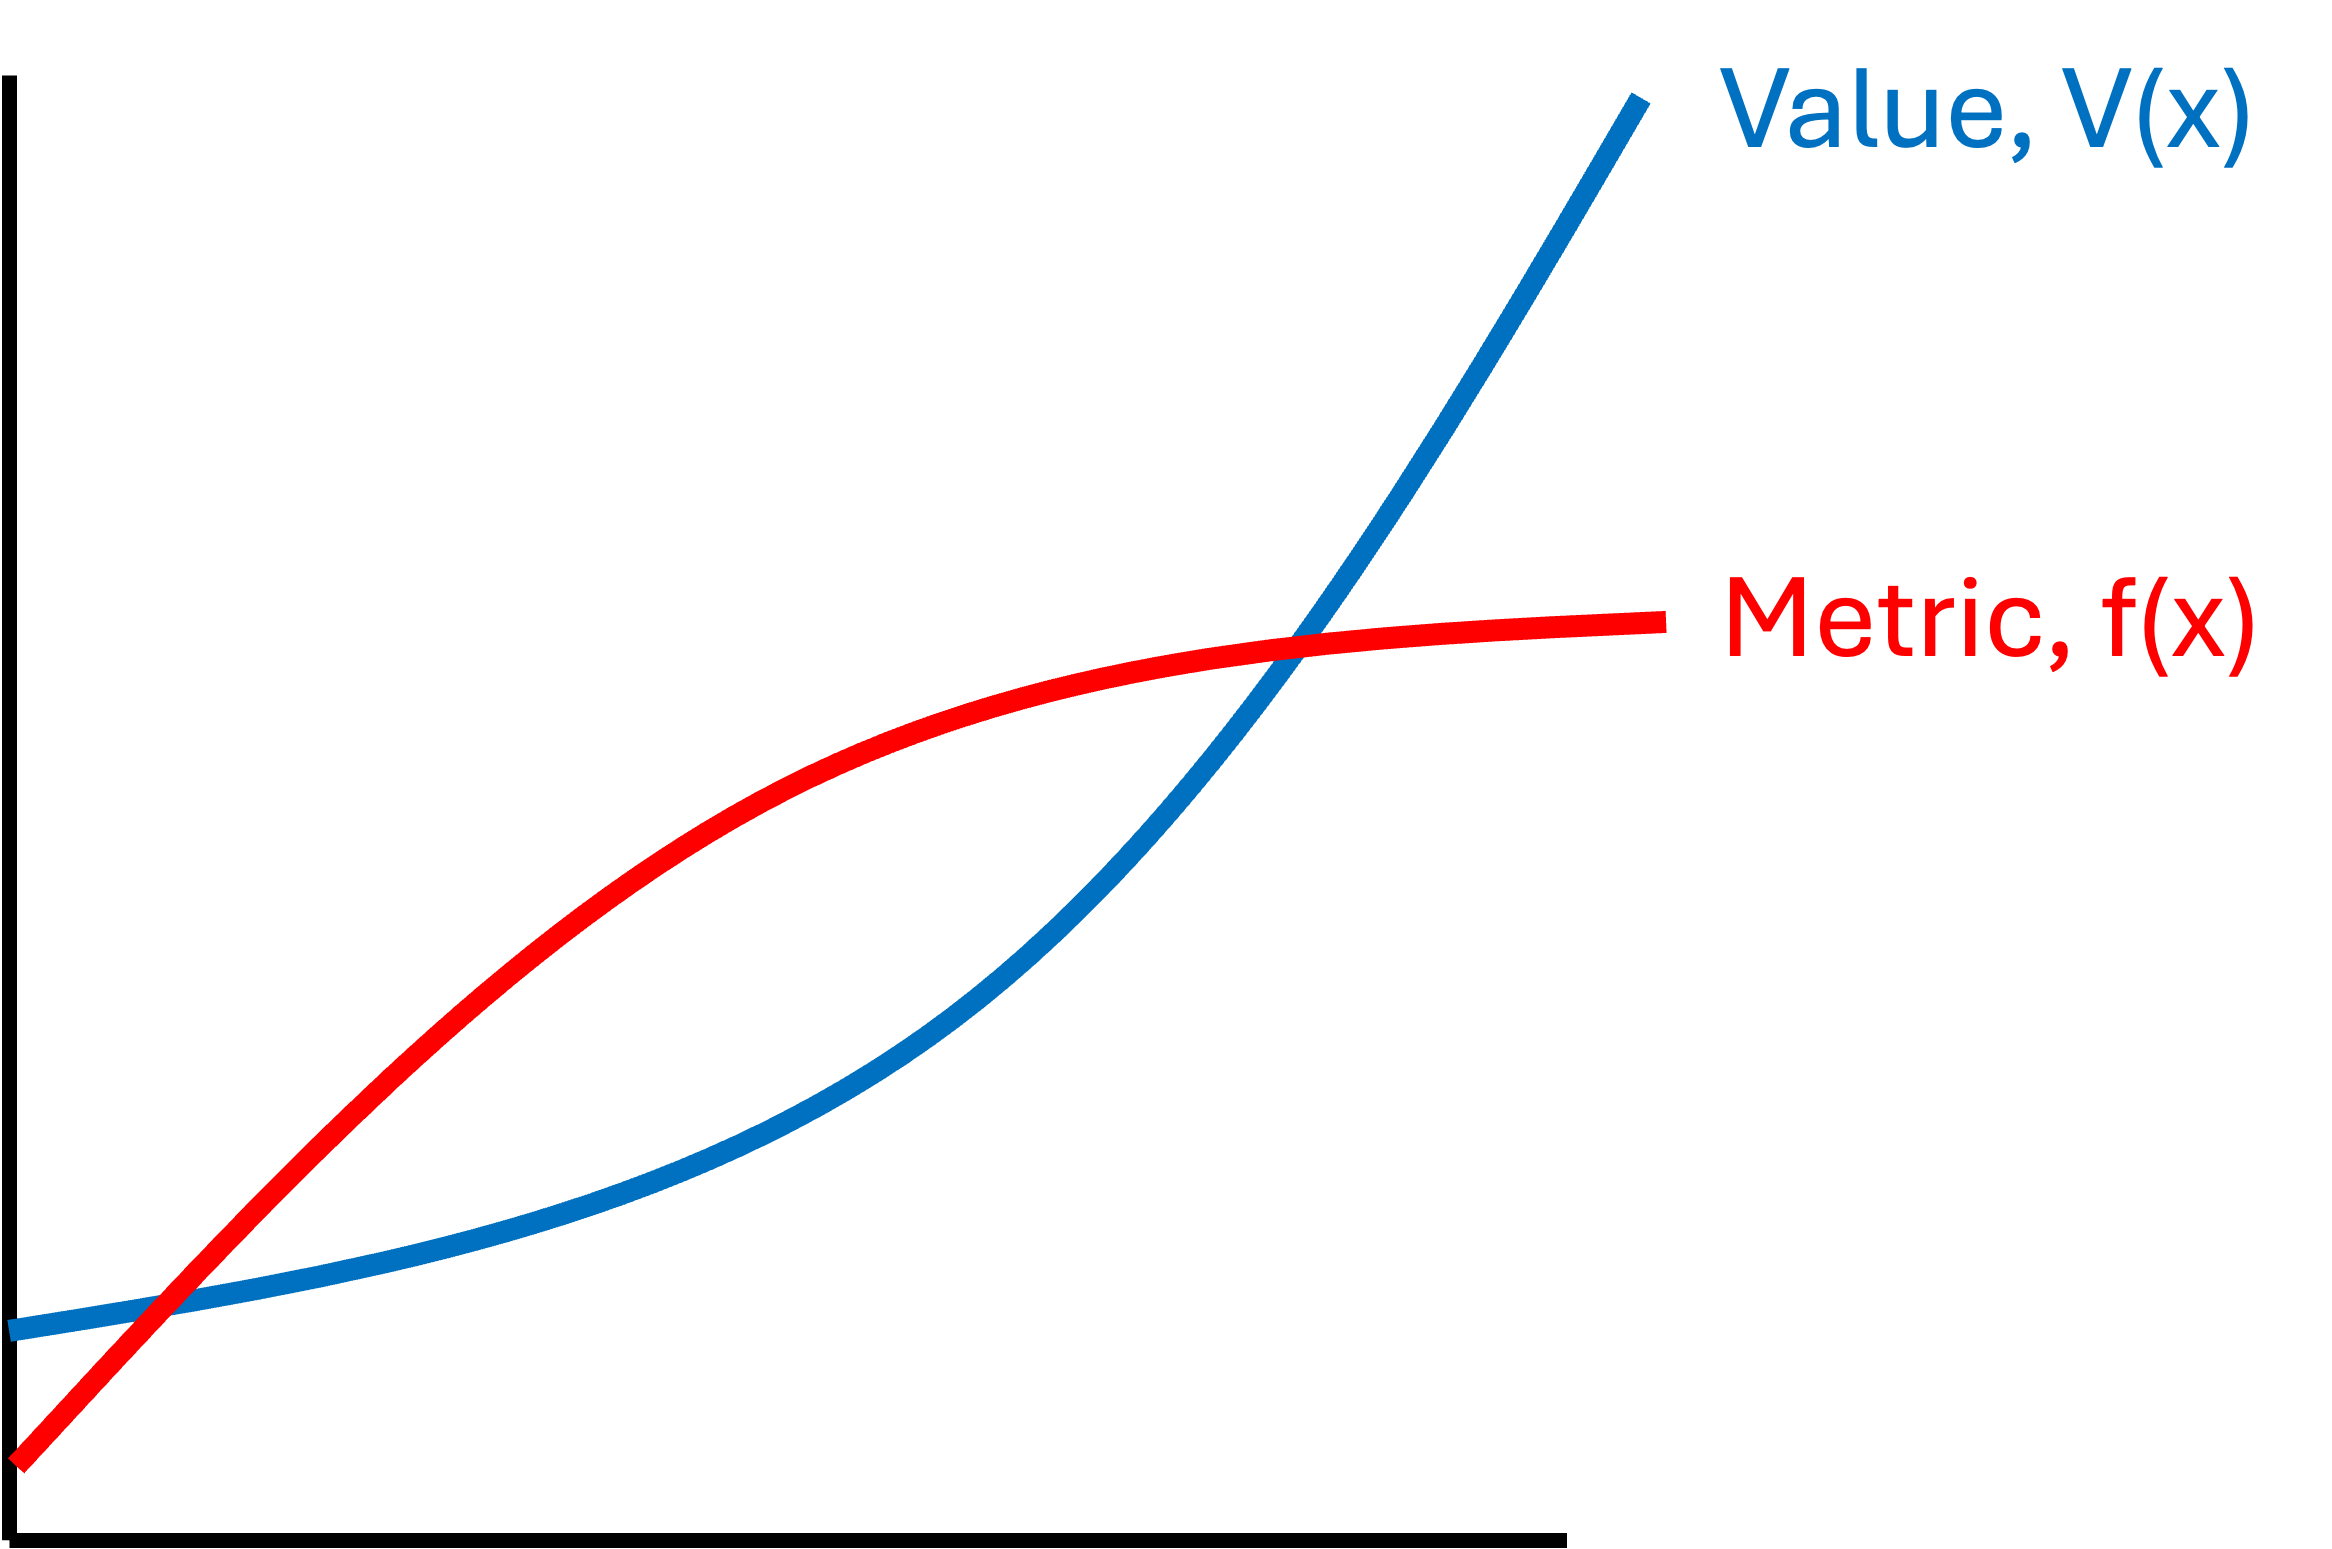
Notably, however, the two functions may not have the same shape. Rather, the only thing that matters is whether $f$ follows the same direction as $V$. For example, one function may be flattening while the other is accelerating upward, but both are increasing:
When one has such a metric $f$ that is monotonic with respect to $V$, then one can use $f$ to reliably to determine whether or not they are improving the system, $x$. That is, if one is considering two systems, $x_1$ and $x_2$, for which $f(x_1) > f(x_2)$, then one can be sure that $V(x_1) > V(x_2)$ and therefore one should prefer $x_1$.
However, critically, there are two tasks that one should not rely on $f$ for:
- One should not use $f$ to determine how much the given system improved. That is, it may be that $f(x_1) > f(x_2)$, however, the difference $f(x_1) - f(x_2)$ may not closely track with $V(x_1) - V(x_2)$. One may have improved the system a great deal with respect to $f$, however, when it comes to real value, $V$, the needly may have barely moved.
- One should not use $f$ to determine success criteria. That is because while $f$ tracks $V$ directionally, it does not tell you anything about the absolute magnitude of $V$. One may have improved the system quite a lot with respect to $f$, but it still is not yet good enough to release into the world!
I would argue that this regime of monotonicity is the very common. Take our usual example of an algorithm for detecting tumors in medical imaging data. In this scenario, one might use simple accuracy as their metric of choice. Clearly, improving the algorithm in terms of accuracy will lead to a more valuable algorithm. However, it is not clear how well accuracy tracks with real benefit in a clinical setting. The two, while correlated, may not be correlated enough to be relied upon for determining whether the algorithm is ready for real-world use.
It is important to sample the value function
Because a value-approximating metric is merely an approximation, I assert that it is important to sample the true value function regularly – that is, to evaluate $V(x)$ for the current system, $x$. In practice, sampling the value function entails making an earnest, holistic assessment of the system’s value independently of any metric.
Sampling the value function might entail having experts perform subjective assessments of the system under consideration. This can be expensive since subjective assessment requires time and energy and is difficult to scale. Moreover, subjective assessments are harder to track and communicate than simple numbers. Nonetheless, sometimes this is the only way.
In other cases, sampling the value function means employing the system in real environments to see how it performs. This can be extremely expensive as it may require conducting real-world studies. In our example of an algorithm for detecting tumors in medical images, one study found that, “human-AI collaboration using an information experiment with professional radiologists… show that providing AI predictions does not improve performance on average.” There is little doubt that the original scientific articles reporting on these algorithms showed many metrics demonstrating good performance; however, in the context of real-world use, they demonstrated less benefit.
Lastly, with the rise of capable agentic AI systems, one can possibly test systems, like new algorithms, in the hands of AI agents within sandboxed environments. For example, a research group at Stanford is exploring using AI agents to simulate human behavior in order to serve as a tool for conducting things like market or policy research. While this line of thinking is only in its infancy, I think agentic AI will emerge as a new tool that can be creatively employed for more cheaply sampling value functions.
Not all systems admit a value-approximating metric that can be used for defining success criteria
Sometimes, because the value function is so complex, it may just not be possible to develop a metric that can be relied upon for things like devising success criteria. That is, it is not possible to know, based on the metric alone, whether the system under consideration is ready for real-world deployment. I do believe that this situation is not uncommon. After all, many “functions” or “mappings” in the real world are incredibly noisy, unintuitive, or non-linear; Why would value functions be any different?
When one is confronted with an intractible value function, it is often wiser to admit this outright than to spend valuable time and energy chasing it. Sometimes, one just has to admit defeat: We can’t quantify “good” even though we know it when we see it.
This is indeed a challenging situation to find oneself. It means that one cannot rely upon an easy, automated way to assess the state of the system and to make decisions. One may feel lost at sea without a compass! But, I would argue that this situation can be navigated, but to do so, one must first acknowledge that one is lost! Once the limitations are acknowledged, one can devise a plan and allocate a budget for sampling the value function.